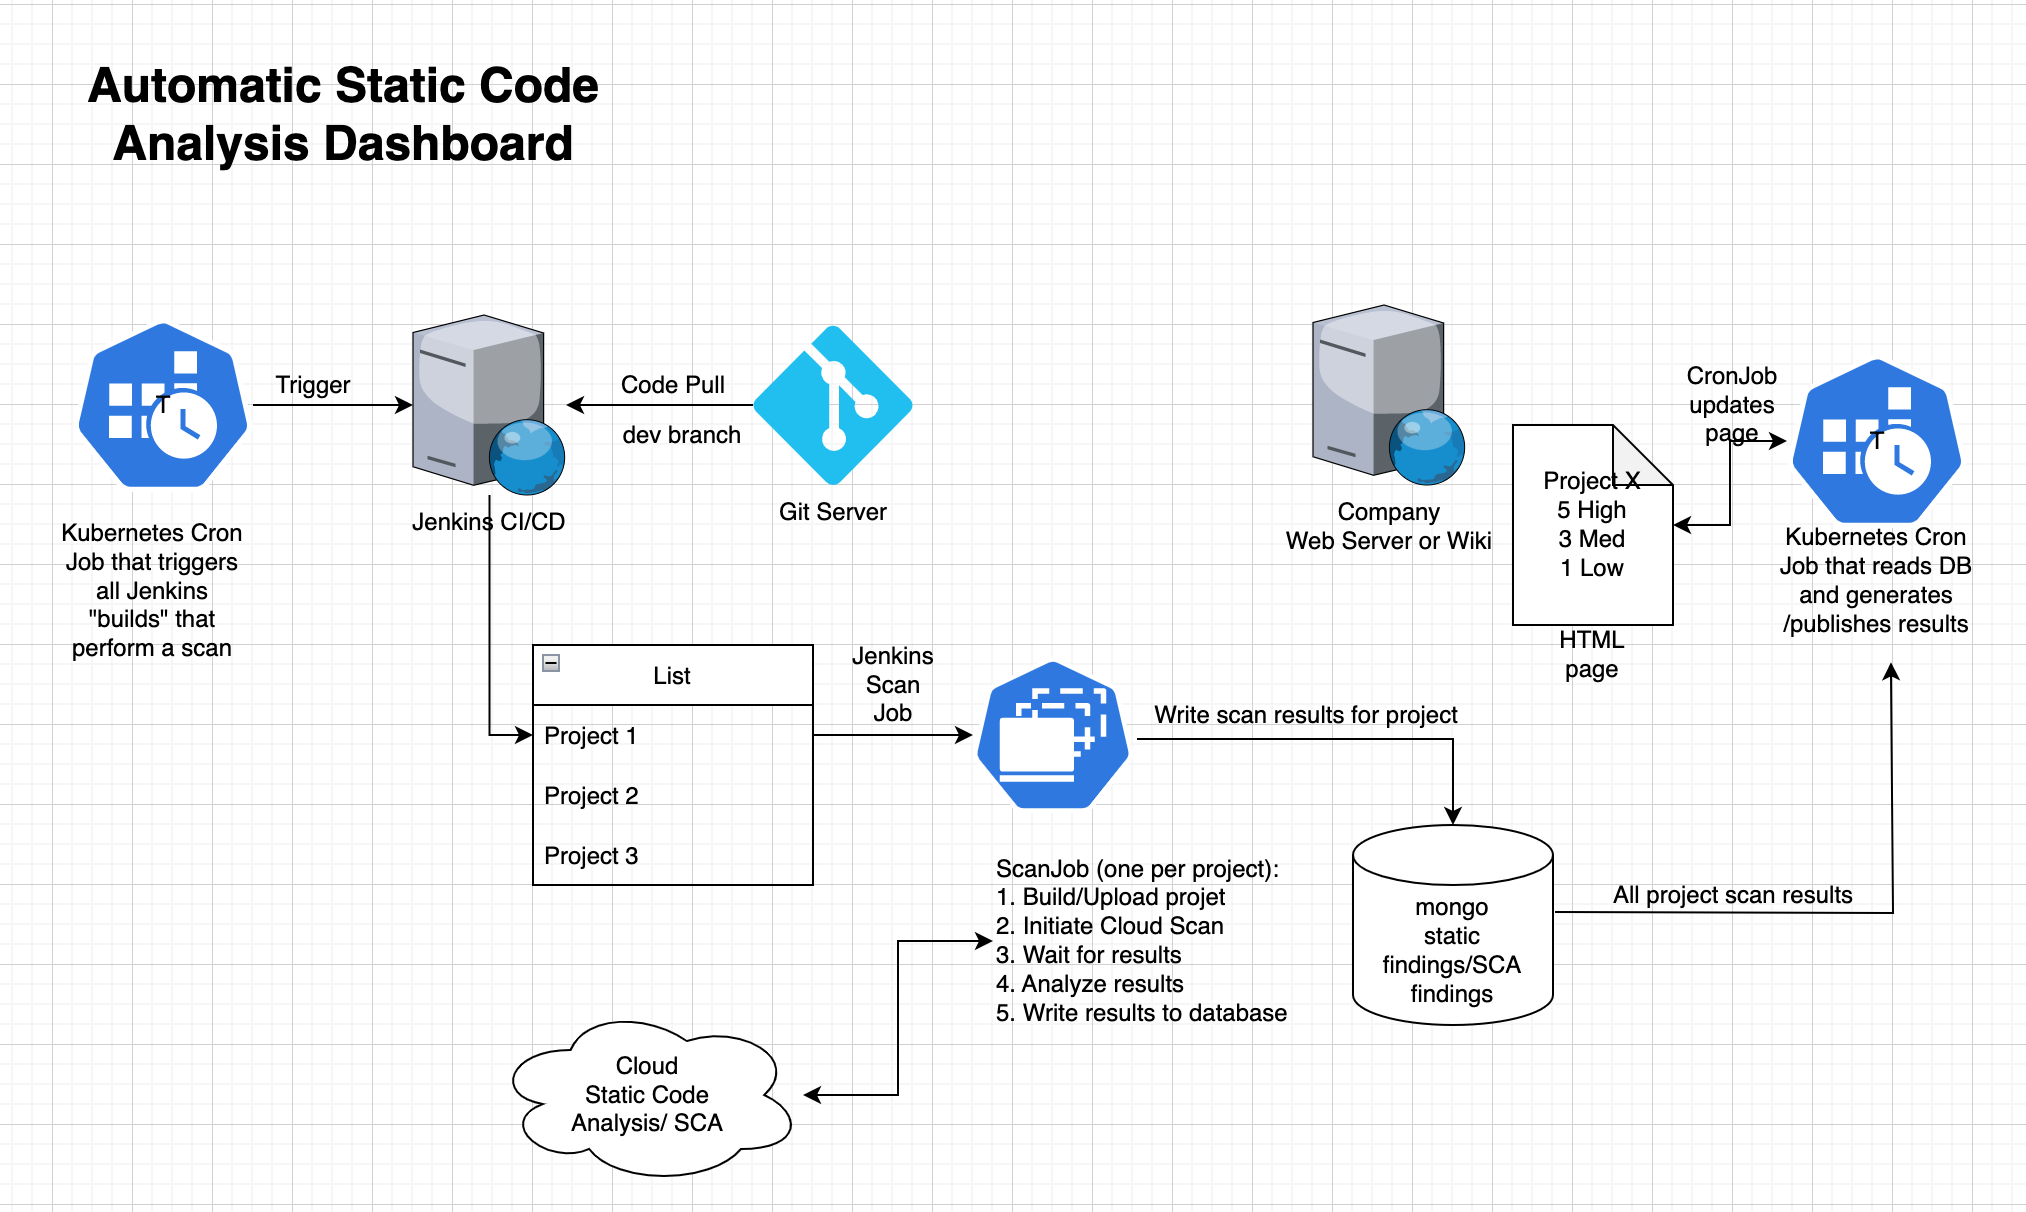
The objective is to automatically create an HTML page that is roughly a table of Project Names, #Highs, #Medium, #Lows, and Time of Scan, similar to what I showed in the previous blog post.
Everything begins with a program, which I’ll refer to as the Build trigger. I plan to distribute this application as a Kubernetes CronJob. This essentially creates a pod with a container that executes on a schedule determined by the CronJob manifest. The build trigger is going to look at a folder on the Jenkins CI/CD and trigger all the contained jobs.
The scan job is the next step we will look at. It runs a scan using the Veracode cloud service. The program then analyses and decodes the findings, and then publishes them to the mongo DB in a succinct format. Our Kubernetes cluster runs Jenkins in a Pod. Jenkins is configured to deploy worker-pods (build-agents) as part of its scripted pipeline and is set up with the Kubernetes plug-in. Except for installing Docker, we installed very little software on the Jenkins agents’ base image. Because of the diversity of computer languages used in our project (C#, Python, Ruby, and Javascript), each build requires its own build runtimes or SDKs. You can easily set up a separate base image for each language to build the software you need.
When employing compiled languages, Veracode favours scanning compiled binaries. The compilation units need to contain debugging information and be in ‘debug mode’. We give each project’s assembled outputs a unique name (or in the case of javascript, python and ruby – source code). This implies that each project needs a unique Dockerfile. That Dockerfile contains the directions for creating and packaging the program artifacts in a way that allows scanning. We launch then a custom application that uploads the build artifact, starts a scan, waits, downloads and analyses the report, and publishes the report and findings to the mongo DB will via the same Dockerfile.
Note that each scan job creates its record in the database. Each project (unit of compilation) will have a record for every build executed and contain the information needed to construct historical graphs of finding severities.
Another cron job must run periodically. This job will run a program that reads the findings for each project from the database. This then produces an HTML page with a table outlining the findings. You can find more technical information about what we need to make all of this work in the next posts. Stay tuned.
Part 3 — A tool that triggers all Jenkins builds in a folder